Sunday, January 13, 2013
Monday, December 17, 2012
Tuesday, December 4, 2012
Temperature in Greenland
Hi Everyone.
I think many
of you have heard about this big news – temperature rising in Greenland causes Greenland
ice sheets melt very quickly, and the melt in the summer 2012 could be the
fastest on records! Oh my god!!! What does it mean? What is the world telling
us? Will it be dangerous? And what does the ice melt imply the situation of
today’s Earth climate?
Recent studies
show that the weird conditions of temperature rising is Greenland are not
caused by external variability or ‘anthropogenic warming’, but from internal
variability of the climate system itself. Kobashi et al. (2011) explained the trend
of temperature in Greenland as follows;
“The Greenland temperature
trend diverges from the global trend in the last 168 years, which raises the
possibility that much of the trend is due to natural variability, not the
recent warming owing to increasing anthropogenic greenhouse gases in the
atmosphere” (cited in Kobashi et al., 2011: L21501).
Besides, Chylek et al.
(2006) observed temperatures from eight stations in Greenland and found that
although the temperatures considerably increased in the past decade, compared
to 1920s-1930s when the temperatures were higher, it represents that present Greenland
temperature is colder.
 |
| The 1995–2005 and 1920–1930 warming periods at Greenland stations show a
similar behavior. Source: Chylek et al. (2006), cited in World Climate
Report, 16 October 2007 |
So, now we can relieve (at least for a while) that the variation of
temperature in Greenland is not implying anything bad. However, further studies
are required and we still have to carefully observe from the records and see the
future trend of Greenland temperature which can be more abnormally fluctuant.
Who knows???
Saturday, November 24, 2012
Greenland: Global Warming Indicator
Hi all,
Since you now know what is global warming and how natural and anthropogenic factors accelerate global climate change, today I’m going to discuss about our important global-warming indicative area--Greenland.
3) Denmark
Since you now know what is global warming and how natural and anthropogenic factors accelerate global climate change, today I’m going to discuss about our important global-warming indicative area--Greenland.
First, do you know which country does Greenland politically and culturally belong to?
1) United States of America
2) United Kingdom
 |
Hugo Ahlenius, UNEP/GRID-Arendal
http://www.grida.no/graphicslib/detail/arctic-conservation-area-caff-topographic-map_e94a
|
 |
2005 Philippe Rekacewicz, UNEP/GRID-Arendal
http://www.grida.no/graphicslib/detail/greenland-denmark-ice-cap-topography-and-bathymetry_8cb9#
|
Greenland’s Geography
Greenland, situating between latitudes 60º 00' and 84º 00' N, and longitudes 11º 00' and 74º 00' E between the Arctic and the North Atlantic Ocean, is a part of North America continent; however, it is an independent country under the Kingdom of Denmark (so choice 3) is correct!). From its location, Greenland is bordered by the Atlantic Ocean to the southeast; the Greenland Sea to the east; the Arctic Ocean to the north; and Baffin Bay to the west. It is ranked as the second biggest ice sheet and the largest island in the globe. How big is it? – Can you guess? It covers the area around 2,166,086 square kilometers (including other offshore minor islands), which 1,755,617 kilometers is covered by ice sheet. “Roughly 85% of the island is permanently covered in ice up to 3,375 meters (11,070 feet) thick. The topography of Greenland’s ice sheet is shown in the image below, based on the data from NASA’s ICESat.
 |
| Image courtesy John P. DiMarzio and the ICESat Science Team http://earthobservatory.nasa.gov/IOTD/view.php?id=5118 |
Because the island is covered by such a thick sheet of ice, it is easy to picture Greenland as a flat, featureless white plain. In reality, the ice’s elevation rises dramatically between sea level around the coastline and the east-central interior, where elevations reach 3,200 meters (10,499 feet). The bright line running north to south roughly through the center of the island shows where the ice sheet peaks in a long island-spanning ridge. Fainter (lower elevation) ridgelines are visible near the northwest coast. The deeper shadows on the eastern (right) side of the major ridgeline indicate that the elevation drops off to the sea more rapidly. On the western slopes, the descent is more gradual.” ICESat Science Team 2004. Topography of Greenland.
Greenland's Weather and Climate
The climate is influenced by the ever-present ice. The ice is partly responsible for the formation of large high pressure systems that dominate the area during the spring and summer.
Arctic temperatures
Greenland has an arctic climate which average temperatures do not exceed 10° C (50° F) in the warmest summer months. In the southern part of the country and the innermost parts of the long fjords, the temperature can, however, rise to more than 20° C (68° F) in June, July or August.
Variable coastal and inland climate
The sea around Greenland affects the climate on land. The stretches of coastline close to the open sea, in particular, are cooled by the sea. Therefore during the summer months it is warmest and driest on land closest to the ice sheet. In all parts of the country the weather is locally changeable and can vary from fjord to fjord and from one valley to the next.
Low humidity
The air is generally very dry in Greenland in relation to many other countries because of its low humidity, so the low temperatures do not feel as cold as you might expect.
Reference: The Weather in Greenland
Saturday, November 17, 2012
Greenhouse gases 4 and Deforestation
What is CFC? How does it increase global warming?
Another important aspect that we have to take into consideration is Deforestation.
Deforestation has many negative effects on the environment. The most dramatic impact is a loss of habitat for millions of species. Seventy percent of Earth’s land animals and plants live in forests, and many cannot survive the deforestation that destroys their homes. Deforestation also drives climate change. Forest soils are moist, but without protection from sun-blocking tree cover, they quickly dry out. Trees also help perpetuate the water cycle by returning water vapor back into the atmosphere. Without trees to fill these roles, many former forest lands can quickly become barren deserts. Removing trees deprives the forest of portions of its canopy, which blocks the sun’s rays during the day and holds in heat at night. This disruption leads to more extreme temperatures swings that can be harmful to plants and animals.” National Geographic Society, 1996-2012, Deforestation.
Chlorofluorocaron or CFC is an organic compound that contains Carbon, Chlorine, and Fluorine. It has extremely long atmospheric lifetimes and is the main cause of stratospheric ozone depletion. CFCs are produced for the purpose of refrigeration and spray can propellants, and enormously used over the years! Although naturally there is very little chlorine in the atmosphere, it turns out that CFCs are a brilliant of introducing chlorine into the ozone layer. Why? Because when the ultraviolet radiation reaches atthis altitude, it breaks down CFCs and frees the chlorine. Under the appropriate conditions, then, the chlorine will attach to one oxygen atom from ozone molecule (O3), becoming Chlorine monoxide (ClO) and leaving one ordinary oxygen (O2) molecule. Moreover, when ClO faces a free oxygen atom (O), the oxygen of ClO bonds with the free oxygen, creating an ordinary oxygen molecule (O2), and freeing chlorine to the atmosphere. Thus, one chlorine atom can destroy thousands of ozone molecules. That's why chlorine has the potential to destroy large amount of ozone. As a result, levels of genetically harmful ultraviolet radiation have increased.
Another important aspect that we have to take into consideration is Deforestation.
Not only do humans release these gases to the atmosphere, but we also destroy ‘the lung of the world’. Why I say ‘lung’? Because trees plays a critical role in absorbing the greenhouse gases that fuel global warming and release oxygen which benefits to all living things. When we cut down the trees, the best source for living of all creatures – food, habitats, clothes, and medicine--, for the benefits of ourselves, we wipe out the ‘helper’ to suck up greenhouse gases entering the atmosphere, so this increases the speed and severity of global warming. According to FAO of United Nations, 4 September 2006, Rome – Most people assume that global warming is caused by burning oil and gas. But in fact between 25 and 30 percent of the greenhouse gases released into the atmosphere each year – 1.6 billion tonnes – is caused by deforestation. Trees are 50 percent carbon. When they are felled or burned, the CO2 they store escapes back into the air. FAO, 2008. Deforestation causes global warming.
The question is what is the biggest driver of deforestation?
1) The need for fuel
2) Agriculture
3) Road building
According to National Geographic, the biggest driver of deforestation is agriculture. So, congratulations for anyone who chooses 2)! They say “Farmers cut forests to provide more room for planting crops or grazing livestock. Logging operations, which provide the world’s wood and paper products, also cut countless trees each year. Loggers, some of them acting illegally, also build roads to access more and more remote forests—which lead to further deforestation. Besides, there is a combination of human and natural factors like wildfires and subsequent overgrazing, which may prevent the growth of young trees.
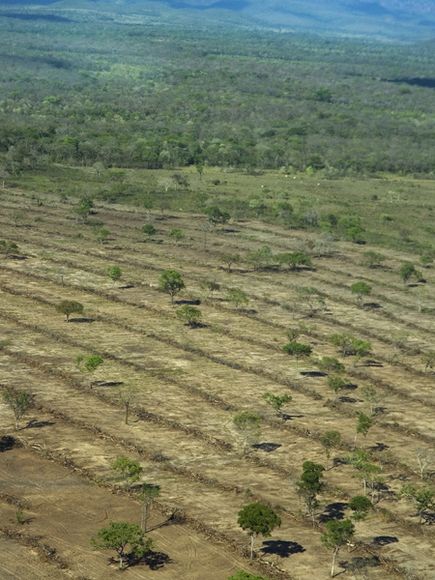 |
Pantanal Deforestation Photograph by NicoleToken trees dot Brazil's Pantanal wetland where dense forest used to stand. Considered the world's largest wetland, the Pantanal is an ecological paradise that covers 54,000 square miles (140,000 square kilometers) in Brazil, Bolivia, and Paraguay, and supports thousands of animal species. http://environment.nationalgeographic.com/environment/photos/rainforestdeforestation/#/pantanal-deforestation_332_600x450.jpg |
 |
| Illegal Logging Site Photograph by Timothy G. Laman
A clearing in Gunung Palung National Park in Indonesian Borneo reveals an illegal logging operation, where loggers fell and mill trees into lumber on site. Deforestation in this area threatens the endangered orangutan population. http://environment.nationalgeographic.com/environment/photos/rainforest-deforestation/#/illegal-logging_205_600x450.jpg
|
 |
Malagasy Slash-and-Burn Photograph by John Michael Fay
|
Scars of bald earth, exposed by slash-and-burn deforestation, encroach on the forests of northeastern Madagascar. Economic pressures have driven the government to exploit one of the most biologically rich areas on Earth for cultivation of coffee beans.
Saturday, November 10, 2012
Greenhouse Gases 3
Hello, how are you guys?

From the last blog, I’m sure that you think the first choice is the correct one but what about the choice 3)?
Why I ask 3)? That’s because if 3) is right, that means 2) must be correct as well! And Yes! 3) is right! (Congrats for you who answer it correctly!) I know some of you may confuse (as I used to!) from the lessons we have learnt in class why Ozone, covering the atmosphere and filtering rays of the sun, and water vapor, can cause global warming. Here’s the thing.
Truly, Ozone (O3) in the stratosphere helps block perilous ultraviolet (UV); however, it also acts as a powerful greenhouse gas. “Ozone behaves differently at different altitudes. High in the stratosphere and mid-troposphere it has positive effects on life at the surface. At the top of the troposphere ozone is a greenhouse gas and at the surface it makes smog. At middle altitudes between the ground and the stratosphere, ozone captures heat much as carbon dioxide does. In fact, pound for pound, ozone is about 3000 times stronger as a greenhouse gas than CO2. So even though there’s much less ozone at middle altitudes than CO2, it still packs a considerable punch. Ozone traps up to one-third as much heat as the better known culprit in climate change.” Patrick L. Barry San Jose Astronomical Association, 2008. Ozone, the Greenhouse Gas. http://ephemeris.sjaa.net/0807/f.html, 28/8/08.

What about water vapor?
The amount of water vapor in the atmosphere exists in direct relation to the temperature. If you increase the temperature, more water evaporates and becomes vapor, and vice versa. So when something else causes a temperature increase (such as extra CO2 from fossil fuels), more water evaporates. Then, since water vapor is a greenhouse gas, this additional water vapor causes the temperature to go up even further.
How much does water vapor amplify CO2 warming? Studies show that water vapor feedback roughly doubles the amount of warming caused by CO2. So if there is a 1°C change caused by CO2, the water vapor will cause the temperature to go up another 1°C. When other feedback loops are included, the total warming from a potential 1°C change caused by CO2 is, in reality, as much as 3°C. So, this is why water vapor is the dominant greenhouse gas. (Skeptical Science. How the water vapor greenhouse effect works) http://www.skepticalscience.com/water-vapor-greenhouse-gas.htm
And of course, I guided you on the second blog—the products we use in daily lives—sprayers, refrigerators (together with freezers, cold water dispensers, refrigerated vehicles, cold storage, and large-scale cooling system in frozen food industries), and air-conditioners also lead to global climate change. Actually, the substances which bring about greenhouse effect are not the products themselves, but come from refrigerants, blowing agent and spray-propellants we put in the products. We call it ‘CFC’.
Greenhouse Gases 2
Hi everyone,
Last
time you knew that Carbon dioxide is one of the stimulants causing global climate
change. What else do you think it can lead to greenhouse effect?
1)
Methane (CH4) and Nitrous Oxide (N2O)
2)
Ozone (O3) and water vapor (H2O
(g))
3)
Both 1) and 2)
Methane
(CH4) is originated from decomposition of living things and
can remain in the atmosphere around 9-15 years. Although there is methane
approximately 1.7 ppm in the atmosphere, interestingly it is over 20 times more
effective in trapping heat than carbon dioxide, that is, it can absorb more
infrared than carbon dioxide does in the same volume. Nowadays, “Methane
is increasingly
emitted from a variety of natural and human-influenced sources.
Human-influenced sources include landfills, natural gas and petroleum systems,
agricultural activities, coal mining, stationary and mobile combustion,
wastewater treatment, and certain industrial process.” U.S. Environmental
Protection Agency, 2011. Methane http://www.epa.gov/methane/,
1/4/11
Nitrous Oxide (N2O) is a clear and colorless gas. Naturally, nitrous oxide is derived from a
wide variety of biological sources i.e. the decomposition of living things. On
a global basis, it is estimated that natural sources account for over 60% of
the total N2O emissions. Nonetheless, it highly increases these days
due to the industries (especially in the United States) using nitric acid in
their production, such as chemical and plastic industries, nylon fiber
manufacturing, agricultural soil management, mobile and stationary combustion
of fossil fuel, and adipic acid
production. It is considered to be a potent greenhouse gas because of its long atmospheric
lifetime which is roughly 120 years! Moreover, it can trap heat 310 times more influential than carbon
dioxide on a per molecule basis! (IPCC, 2001c)
Global average
atmospheric concentrations of N2O have increased from about 270
parts per billion by volume (ppbv) in 1750 to 314 ppbv in 1998, which equates
to a 16% increase for the period. In the last two decades, atmospheric
concentrations of N2O continue to increase at a rate of 0.25% per
year. There has been significant multi-year variance in the observed growth of
N2O concentrations, and the reasons for these trends are not yet
fully understood (IPCC, 2001b).
http://www.ghgonline.org/humaninfluencebig.htm
http://www.ghgonline.org/humaninfluencebig.htm
 |
| This image is a work of the National Oceanic and Atmospheric Administration, taken or made during the course of an employee's official duties. As works of the U.S. federal government. NASA, Global Climate Change http://ete.cet.edu/gcc/?/resourcecenter/slideshow/3/48 |
 |
This figure shows the relative
fraction of man-made greenhouse gases coming from each of eight
categories of sources, as estimated by the Emission Database for Global
Atmospheric Research version 3.2, fast track 2000 project. These
values are intended to provide a snapshot of global annual greenhouse gas
emissions in the year 2000.
The top panel shows the sum
over all greenhouse gases, weighted by their global warming potential
over the next 100 years. This consists of 72% carbon dioxide, 18% methane,
8% nitrous oxide and 1% other gases. Lower
panels show the comparable information for each of these three primary
greenhouse gases, with the same coloring of sectors as used in the top chart.
Segments with less than 1% fraction are not labeled.
The increase in greenhouse gas concentrations in the Earth's atmosphere is believed to be the
primary cause of global warming.
Subscribe to:
Posts (Atom)